The map MAPPA
You have a hypothesis.
Search 50,000+ pre-processed spatial samples. Find new targets, build virtual cohorts and test ideas before you generate new data.
- 01In silico target discovery
- 02Virtual cohorts
- 03Context for your pilot data
The spatial map of human biology
Search it. Zoom in. Find your way. Now for human tissue. We turn spatial omics data into one navigable atlas, so you can see where disease begins, not only what it expresses.
Trusted by researchers at
Published in Neuron, 2025





Why now
Every spatial experiment charts a small piece of human tissue. Most of those charts sit in separate files, formats and labs. We join them into one map that you can search, compare and zoom, from the whole organism down to a single transcript.
Every scale
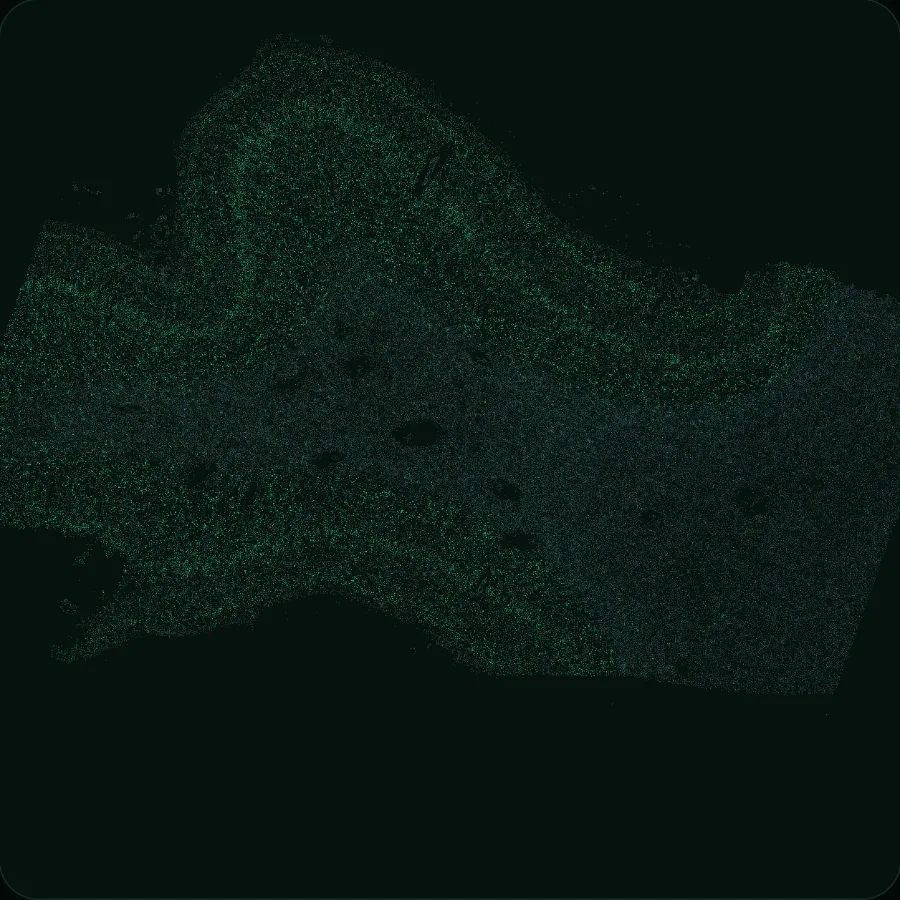
This view needs WebGL. It zooms from the body into a real human cortex section, down to single transcripts.
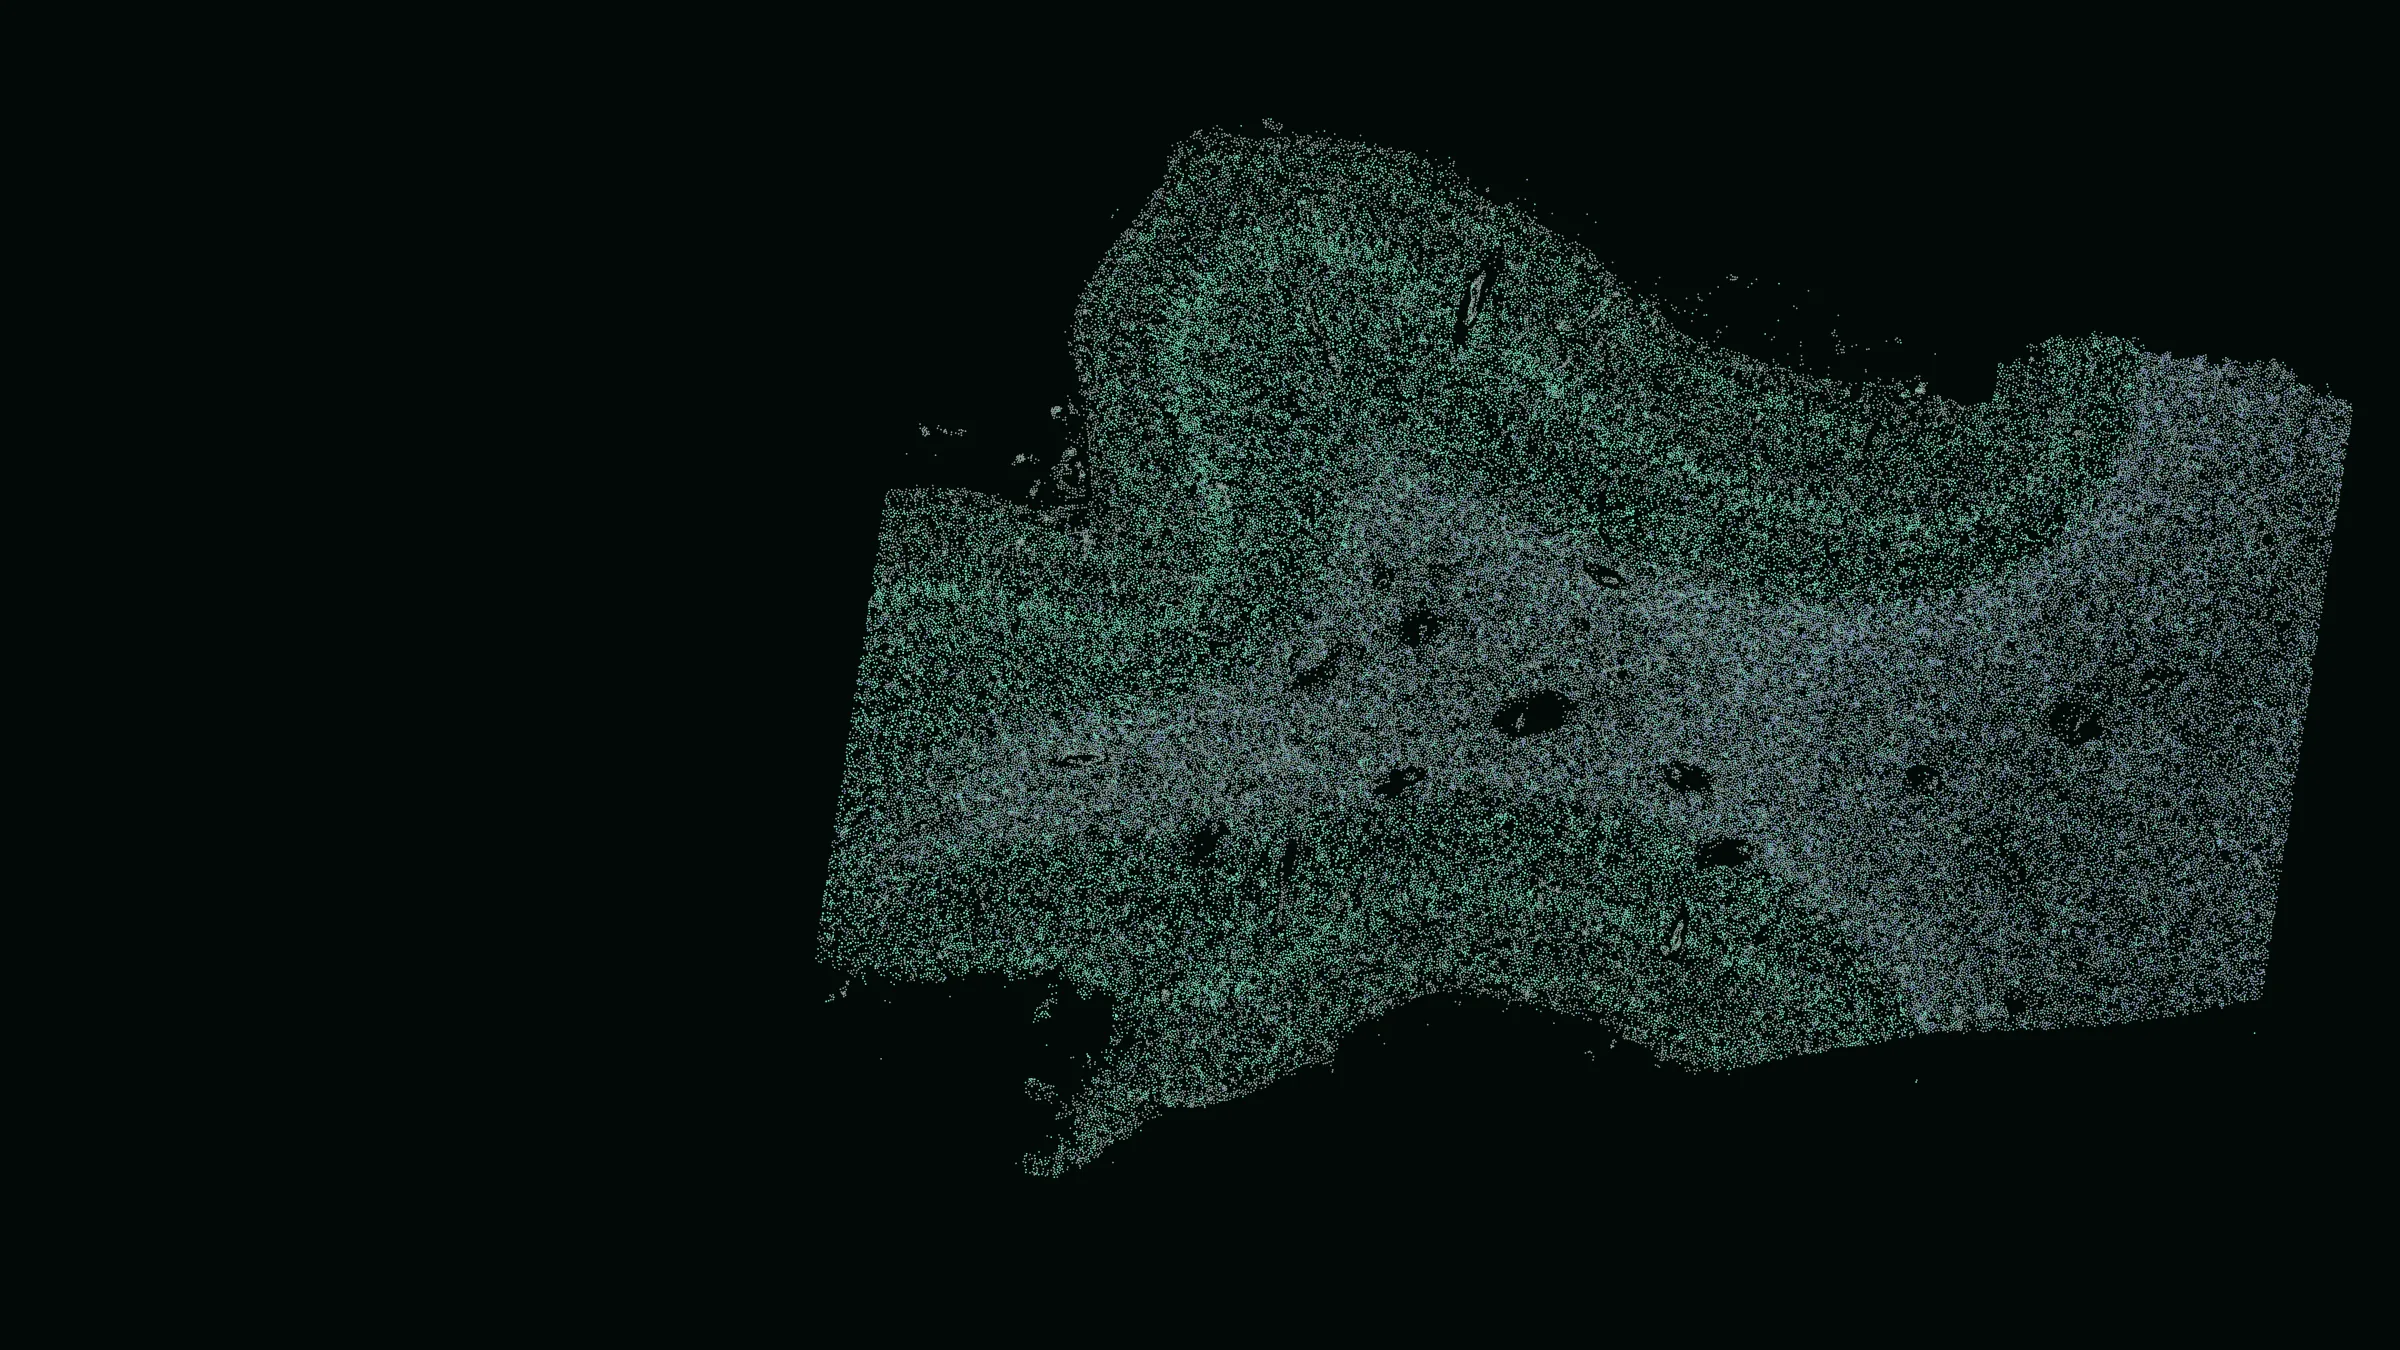
Body, brain and sample site: illustration. Hero background, tissue, cells and transcripts: cortex of a human Alzheimer's disease donor, Xenium, A. Millet, adapted: doi:10.5281/zenodo.8206638, CC BY 4.0.
Neighbourhoods
An analysis describes each cell by the molecules of its 15 nearest cells, then groups the cells whose surroundings match. In this strip of human cortex, the groups follow the tissue from the surface into white matter, each with its marker genes.
The interactive view is not available right now. It groups the cells of a real human cortex section into neighbourhoods.
Brain surface
Marker genes: SFRP2, CXCL14 and AQP4
Outer cortex
Marker genes: GAD1, GJA1 and FGFR3
Middle cortex
Marker genes: RORB, TSHZ2 and SLC17A7
Deep cortex
Marker genes: SLC17A7, SYNPR and CCK
White matter, near the cortex
Marker genes: SERPINA3, IGFBP5 and IFITM3
White matter, myelin-rich
Marker genes: MOG, CLDN11 and MOBP
Vessels and meninges
Marker genes: CEMIP, DCN and IGFBP4
Not assigned
This cell's group holds under 1% of the section's cells.
Molecules around this cell
In this cell and its 15 nearest cells; each molecule counts for the nearest cell.
Hover or tap a cell to read its neighbourhood.
Molecules SFRP2RORBSLC17A7MOG
SFRP2RORBSLC17A7MOG
Neighbourhoods, from the surface into white matter
Method: niches by squidpy UTAG on each cell's 15 nearest cells (resolution 0.5), 112,367 cells with at least 5 transcripts. Marker genes: detected in at least 10% of a neighbourhood's cells, significant by t-test (scanpy), sorted by fold change. Strip of 2.0 × 2.6 mm.
Tissue, cells and molecules: cortex of a human Alzheimer's disease donor, Xenium, A. Millet, adapted: doi:10.5281/zenodo.8206638, CC BY 4.0.
How it works
Search 50,000+ pre-processed spatial samples. Find new targets, build virtual cohorts and test ideas before you generate new data.
Hand us raw data. Our end-to-end engine charts it and returns publication-ready results, fully reproducible.
Use cases
Mine the atlas for spatial biomarkers and therapeutic targets.
Assemble disease cohorts from existing data. No wet lab, no waiting.
Compare your first slides against thousands of reference samples.
Map immune niches and exhaustion at subcellular resolution.
Place rare cell states inside lesions across many donors.
Figures, interactive reports and queryable data objects.
Results
We partnered with Cambridge to process fragmented spatial cohorts from post-mortem brain tissues at scale. The result: identification of Disease-Associated Radial Glia-like cells in chronic MS lesions.
“By scaling this spatial analysis, we successfully identified DARGs in chronic active lesions - uncovering a novel cellular axis for disease pathobiology and potential therapeutic intervention.”
We partnered with SOTIO Biotech to process complex Xenium spatial cohorts comparing cervical and head and neck cancers. The result: identifying dense regulatory T cell populations and localized exhaustion signatures as key drivers of immunosuppression in cervical cancer.
“Generating the spatial data was only the first step. Carta Genum provided the dedicated bioinformatics capacity we needed, turning our complex datasets into clear, publication-ready biological insights.”
We work with a small number of labs at a time. Let's see if we're a fit.